You Pay for Cluster Capacity, Not Average Usage

Requests are not waste: teams use them to preserve schedulable capacity for bursts, startup spikes, and reliability. They also determine how workloads fit on nodes, so more headroom than a workload needs can block consolidation or occupy capacity another workload could use.
AstroPulse shows requests beside time-averaged usage for every cluster, namespace, and application. The gap starts an investigation; it does not prescribe a new request.

Compare requested headroom with average use, then decide whether the gap is intentional.
A real example: 0.47% average request utilization
This healthy namespace on a cluster running the Astro agent requested far more CPU than it used on average over 24 hours:
These are averages, not peak demand. Before changing the request, inspect burst windows, startup behavior, autoscaling, throttling, latency, and SLOs. Keep the headroom the workload needs; reduce only what evidence shows it does not.
Why the gap matters
Requests provide scheduling guarantees and burst headroom. Too little can reduce CPU share under contention or increase memory eviction risk; too much can block consolidation. The goal is appropriate headroom—not 100% average utilization.
See the cluster, then drill down
The same gap appeared across a GKE cluster running 24 applications on four nodes:
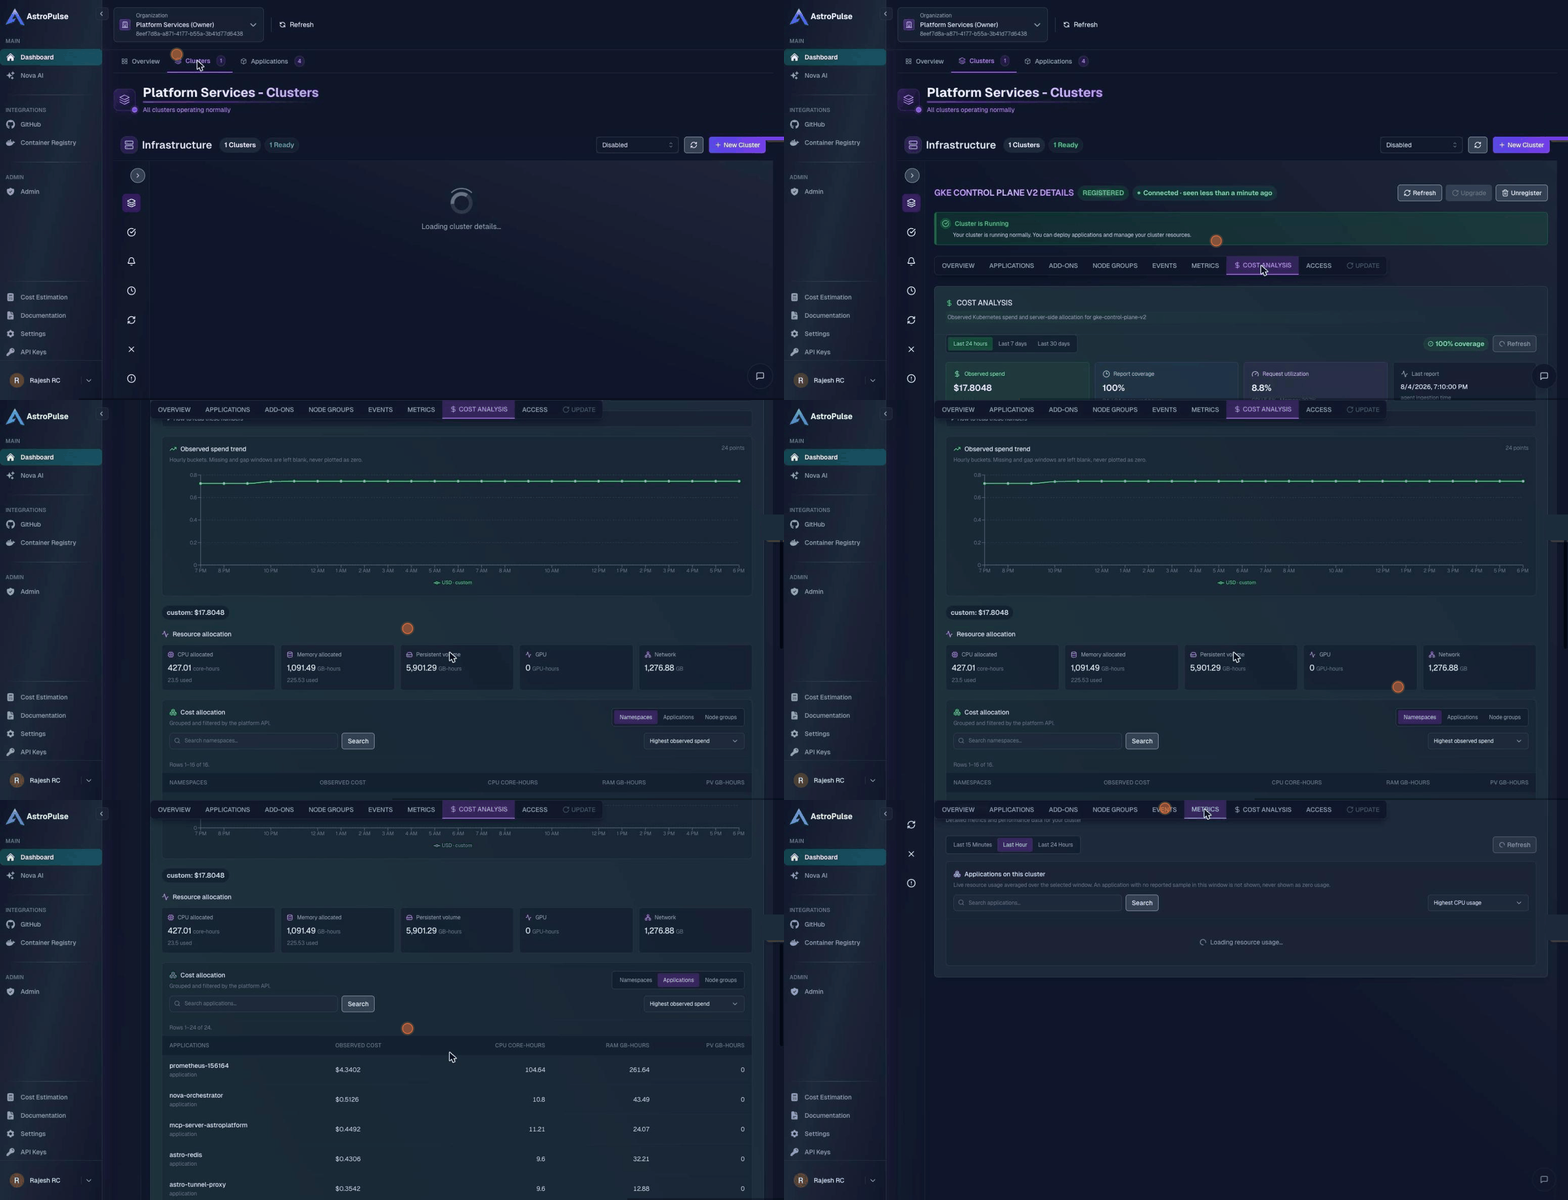
- $17.80 over 24 hours, with 100% coverage.
- 8.8% average request utilization overall: 5.5% CPU and 20.7% memory.
- $11.17 from
monitoring, more than every other namespace combined.
The cluster view shows where to look. The application view shows who owns it. Managed add-ons are included because they consume the same resources:
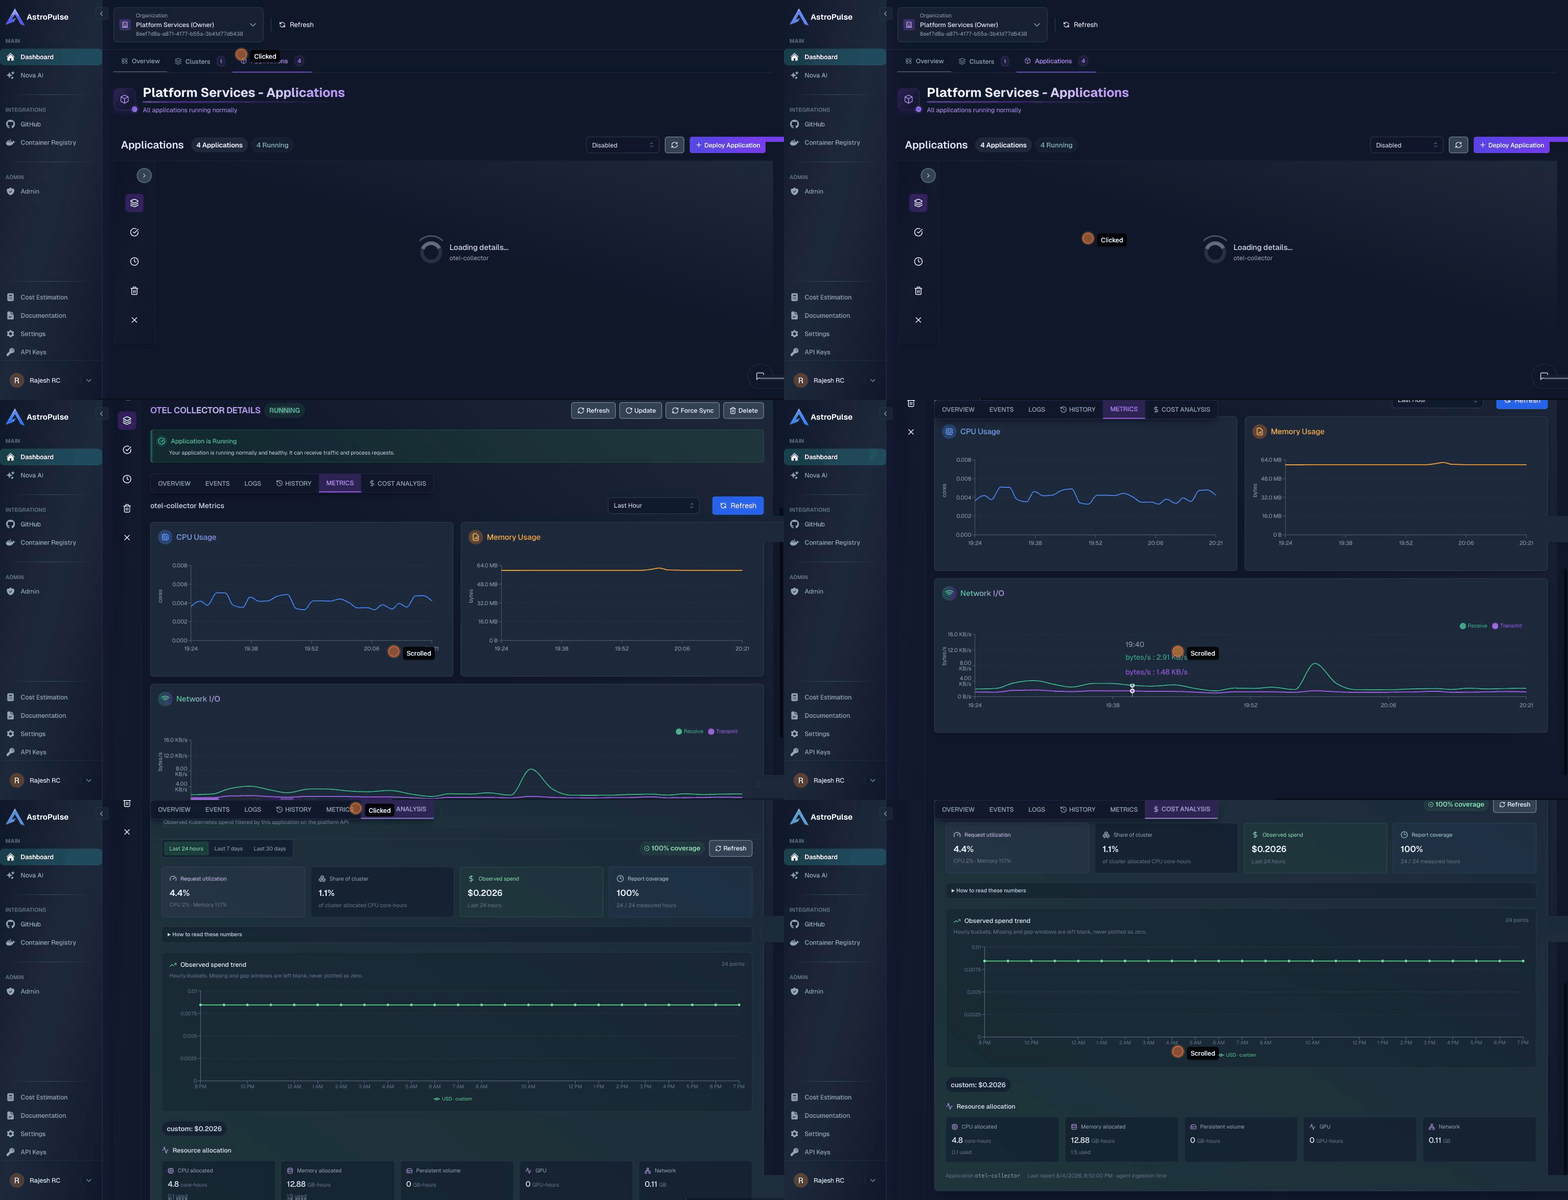
Use the Console, astroctl, or Nova to reach the same data:
$ astroctl infra k8s cost allocation my-cluster --group-by namespace --sort-by efficiency --sort-order asc
Metrics and cost use the cluster agent
| Resource metrics | Cost | |
|---|---|---|
| Shows | CPU, memory, and network | Allocation, usage, and optional currency |
| Arrives | Every few minutes | After each hour closes |
| Requires | Connected Astro agent | Compatible agent + Cost Visibility add-on |
This works on provisioned and registered clusters across supported providers once a compatible Astro agent is connected. Agent installation and capabilities are managed through AstroPulse; BYO cluster registration installs it by default.
How the numbers reach you
Both views come from the same in-cluster path:
Customer cluster
Your cloud account or data center

Astro Platform
Stores scoped summaries and serves them through one consistent data layer.
The agent samples and attributes workloads inside the customer cluster, then sends aggregated application and namespace summaries to AstroPulse.
- Raw billing rows, logs, environment variables, and application data stay in your environment.
- Reports use the cluster's established identity and organization scope.
- Finished cost windows retry after brief disconnects; unrecoverable windows remain gaps, never
$0.
Install it
The agent comes first on every provider. When registering an existing cluster, AstroPulse installs it by default:
$ astroctl infra k8s register --cluster-name my-cluster
If AstroPulse reports that an existing agent is out of date, update it before installing Cost Visibility:
$ astroctl infra k8s register agent update --cluster-name my-cluster
Then install Cost Visibility from the cluster's Add-ons tab or with a manifest. Metrics appear within minutes; the first cost window arrives after the current hour closes.
For managed and existing Prometheus options, see Cluster Add-ons.
Choose how to price usage
Quantities work without a price. Add currency only when you have a trusted source:
- Unpriced: allocation, usage, and utilization remain available without currency.
- Your rates: provide negotiated, committed-use, spot, or internal chargeback rates.
- Cloud bill: read a GCP or AWS billing export inside the cluster and include provider discounts.
Billing credentials and raw exports stay in your environment. AstroPulse receives only aggregated cost summaries. A cloud-bill label means provider-billed rates were used; it does not mean AstroPulse reconciled the total against the invoice.
Honest numbers, bounded history
The product keeps uncertainty visible:
- Utilization can exceed 100%; missing requests read
None set. - Used CPU is time-averaged and does not define safe burst headroom.
- Missing samples break charts instead of appearing as zero.
- Metrics are retained for about 24 hours.
- Cost history is retained for 1 day on Developer and 395 days on Enterprise.
- Removing a cluster removes its cost history, so export first if it matters.
Start with one cluster
Open Metrics on a cluster with the Astro agent, install Cost Visibility on a non-production cluster, then review the largest request-to-average gaps. Validate bursts and reliability requirements before changing anything.
See Cost and Resource Metrics for interpretation and Cluster Add-ons for installation and pricing options.
Connect one cluster, install Cost Visibility, and compare allocated against used.